Loading...
Healthcare Access14 min readUpdated
Women's caregiving burden statistics: unpaid hours, economic value, and health costs
61% of U.S. family caregivers of adults are women. They average 27 hours of care a week, and AARP values that unpaid work at $1.01 trillion in 2024. Hours, sandwich-generation share, workplace costs, and caregiver health, with the primary source next to each number.

Written By
Dr. Sarah Jenkins
Board Certified OB/GYN

Medically Reviewed By
Dr. Emily Chen
Chief Medical Officer
Share
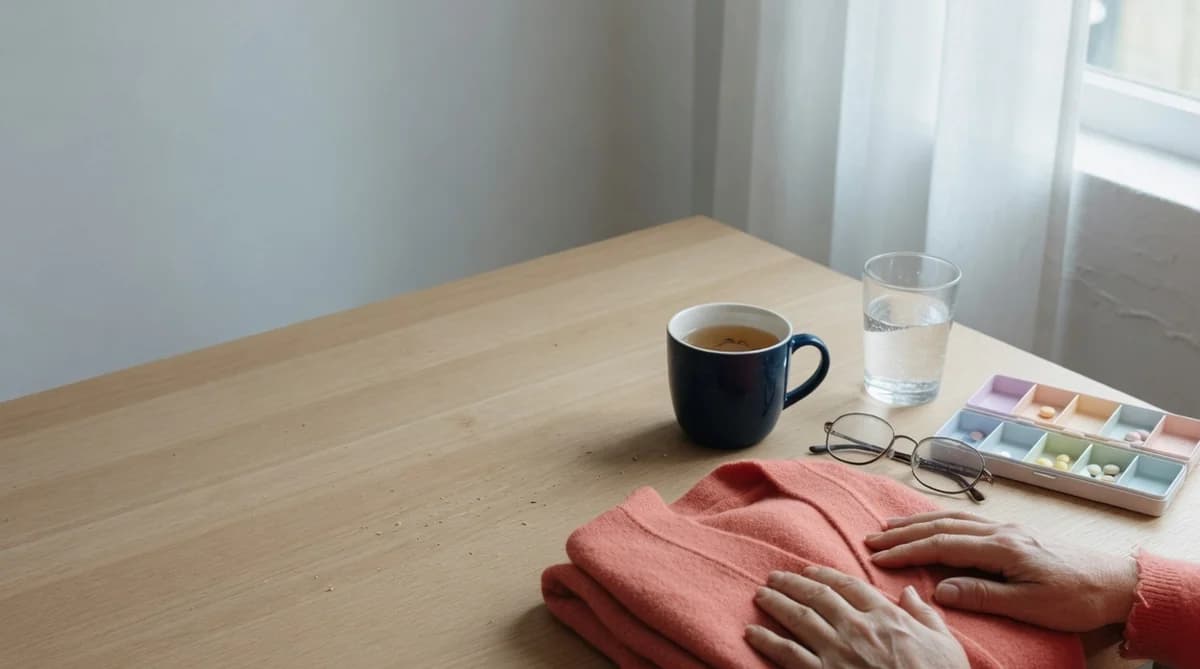
She was 48, a salaried analyst, and the primary person managing her mother's progressive memory loss. She came in for a Pap and stayed for blood pressure that had jumped 18 points in a year. Sleep was fragmented. She had already turned down a promotion because the extra travel would leave no one for mid-afternoon pharmacy problems. When I asked how many hours a week the caregiving took, she laughed without humor and said, "I stopped counting after twenty."
That answer is not unusual. Unpaid family care for adults is a women's health issue that rarely lands on a problem list, even when it drives hypertension, missed screening, mood symptoms, or a job exit. The numbers below are ones a reporter on deadline can lift, with the primary source named beside each figure.
According to AARP and the National Alliance for Caregiving's Caregiving in the US 2025 report, three in five family caregivers of adults are women. AARP's 2026 economic-value update put the economic value of family care for adults at $1.01 trillion in 2024. Those two numbers frame the rest of this page: hours, sandwich-generation load, career costs, and caregiver health.
Key takeaways
- 61% of U.S. family caregivers of adults are women, and the average caregiver is about 51 years old, according to AARP and the National Alliance for Caregiving's Caregiving in the US 2025 report.
- Family caregivers of adults spend an average of 27 hours per week providing care; 24% provide 40 or more hours weekly, and women are more likely than men to provide constant care (22% vs. 16%).
- AARP's 2026 economic-value update estimates that 59 million caregivers of adults provided 49.5 billion hours of care in 2024, valued at $1.01 trillion. That exceeds total Medicaid spending that year ($932 billion).
- 29% of family caregivers are sandwich generation caregivers, caring for a child under 18 at home while also supporting an adult; among caregivers under 50, that share rises to 47%.
- One in five caregivers report fair or poor health, and women report higher rates of emotional strain (41% vs. 33% of men) and difficulty caring for their own health (26% of women vs. 23% overall), per the 2025 AARP/NAC survey.
$1.01 trillion
estimated economic value of unpaid family caregiving for adults in the United States in 2024: 49.5 billion hours at an average of $20.41 per hour.
AARP Public Policy Institute, 2026 economic-value update
61%
Share of family caregivers of adults who are women
AARP/NAC, Caregiving in the US 2025
27 hrs
Average weekly hours of care
AARP/NAC, Caregiving in the US 2025
29%
Sandwich generation caregivers (child + adult)
AARP/NAC, Caregiving in the US 2025
Women's unpaid caregiving at a glance
- Caregivers who are women
- 61% of family caregivers of adults (AARP/NAC 2025)
- U.S. adults who are caregivers
- About 1 in 4 (63 million total; 59 million care for adults)
- Average weekly care hours
- 27 hours; 24% provide 40+ hours
- Economic value (2024)
- $1.01 trillion (AARP 2026 economic-value update)
- Sandwich generation share
- 29% overall; 47% of caregivers under 50
- Fair or poor self-rated health
- 1 in 5 caregivers (AARP/NAC 2025); 19.2% in CDC BRFSS 2015-2017
| Category | Amount (billions) |
|---|---|
| Economic value of family caregiving | 1010 |
| All private-business health care spending | 968 |
| Total Medicaid spending (all government levels) | 932 |
| All LTSS and post-acute care spending (2023) | 564 |
| All out-of-pocket health spending | 557 |
Source: AARP Public Policy Institute, 2026 economic-value update. Amounts rounded as reported in the source figure.
| Data year | Economic value ($ billions) |
|---|---|
| 2006 | 350 |
| 2009 | 450 |
| 2013 | 470 |
| 2017 | 470 |
| 2021 | 600 |
| 2024 | 1010 |
Source: AARP Public Policy Institute economic-value series (Table 1, 2026 update). Methods and caregiver definitions have varied across editions; AARP cautions that estimates are not fully comparable year to year.
Who carries the load
Caregiving in the US 2025 estimates that 63 million American adults provided ongoing care to adults or children with medical conditions or disabilities. That is nearly one in four adults, up from 18.2% prevalence in 2015. Of those 63 million, 59 million cared for an adult age 18 or older (22.5% of U.S. adults). AARP's public summary put the increase over the past decade at about 45%, or nearly 20 million more caregivers.
Gender remains the sharpest demographic feature. Three in five caregivers of adults are women (61%), and two in five are men (38%), with just under 1% reporting another gender identity. CDC BRFSS caregiver-module data from 2015-2017 found women accounted for 58.1% of informal unpaid caregivers across 44 states, D.C., and Puerto Rico. That is a lower share, a different time window, and a 30-day screen rather than AARP/NAC's broader frame. Both sources still put women in the clear majority.
The average caregiver of an adult is 50.6 years old (about 51 in AARP's plain-language summary). One-third are ages 50-64. Six in 10 are non-Hispanic white (61%), 16% Latino/Hispanic, 13% non-Hispanic African American/Black, and 6% Asian American, Native Hawaiian, or Pacific Islander. One in five (20%) live in rural areas. Most care for a relative; 11% care for a friend or neighbor. Nearly a quarter (24%) support more than one care recipient.
Care recipients are mostly older adults; nearly half are 75 or older. Cognitive impairment is common: 27% of caregivers report Alzheimer's disease, dementia, or another memory-related problem. That intersects with the sex pattern in dementia (covered in our review of Alzheimer's and dementia statistics in women), because women are both more likely to develop Alzheimer's and more likely to provide the unpaid care that follows.
Hours, intensity, and medical tasks
On average, caregivers of adults spend 27 hours per week providing care (mean 27.3 hours in the survey). One-third (35%) provide more than 20 hours a week. Nearly one in four (24%) provide 40 or more hours. That is a full-time second job without pay, or a shift that never really ends.
Women are more likely than men to provide constant care: 22% versus 16%. The survey defined constant care as on-and-off around-the-clock help, continuous care with only small sleep breaks, or full 24/7 care. That intensity gap matters more than the 61% headcount alone. Being listed as a caregiver is not the same as being the person who bathes and transfers a parent, or who stays up for nighttime wandering.
Task complexity has risen with the hours. Two-thirds help with at least one activity of daily living (ADL) such as bathing, dressing, toileting, feeding, or mobility. More than half (55%) perform medical or nursing tasks typically handled by health professionals (injections, catheter care, wound care, medication management), yet only 22% report receiving training. Female caregivers assist with medical and nursing tasks more often than male caregivers (58% vs. 51%). Forty-four percent are in high-intensity situations on the Level of Care Index. Thirty percent have been in the role for five or more years, a clear increase from 2020.
Proximity drives intensity. Forty percent of caregivers live with the care recipient; another 35% live nearby. Co-resident caregivers provide more hours and less often use paid help (22%) or other unpaid help (36%). Among co-resident caregivers, 22% provide more than 21 hours of care weekly. Respite use remains low: 39% say respite would help, but only 13% use it.
| Hours of care per week | Share of caregivers |
|---|---|
| Less than 1 hour | 10% |
| 1-8 hours | 33% |
| 9-20 hours | 22% |
| 21-40 hours | 11% |
| 41+ hours | 24% |
Source: AARP and National Alliance for Caregiving, Caregiving in the US 2025, Figure 15. Average hours of care: 27.3 per week. Percentages rounded as reported.
The trillion-dollar figure
If you need one number for a headline or a budget hearing, use this one: $1.01 trillion.
AARP's 2026 economic-value update, drawing on the 2025 caregiving survey, estimates that 59 million caregivers of adults provided 49.5 billion hours of care in 2024 at an average value of $20.41 per hour. The national economic value is $1.01 trillion. About 37 million of those caregivers (63%) were providing care each month. The 49.5 billion hours equal roughly 23.8 million full-time workers, or about 17% of all full-time U.S. workers, per AARP's comparison.
That value exceeded total Medicaid spending in 2024 ($932 billion) and all health care spending by private businesses ($968 billion). It was nearly twice all long-term services and supports and post-acute care spending from all payers in 2023 ($564 billion) and nearly twice all out-of-pocket health spending in 2024 ($557 billion). Unpaid family care is not a side note to the formal system. In dollar terms it is larger than the public program most people associate with long-term care.
Earlier AARP economic-value editions estimated $350 billion in 2006, $450 billion in 2009, $470 billion in 2013 and 2017, and $600 billion in 2021. The 2024 jump reflects higher hours, higher replacement wages, and methodological updates. AARP notes methods and caregiver definitions have varied, so the series is directional rather than fully comparable year to year. Two other limits matter. The method prices hours at a replacement wage and does not fully count lost wages or reduced Social Security credits. The trillion-dollar total covers care for adults, not the full child-disability load inside the broader 63 million figure.
Sandwich generation caregivers
Almost one-third (29%) of family caregivers in the 2025 survey have children or grandchildren under 18 living at home while also caring for an adult family member or friend. That is sandwich generation caregiving in survey terms: simultaneous child and adult care, not merely the potential of having living parents and living children.
Age concentrates the load. Among caregivers under 50, 47% are sandwich generation caregivers, compared with 14% of older caregivers. More African American/Black caregivers (36%) and Hispanic/Latino caregivers (43%) are sandwich generation caregivers than the 29% average. Paid family caregivers (those who receive some compensation through Medicaid, VA, or state programs) are also more often sandwich generation caregivers (36% vs. 27% of unpaid caregivers).
Peer-reviewed National Study of Caregiving data point the same way. Lei and colleagues reported in the Journal of the American Geriatrics Society that 24.3% of adult-child caregivers of older adults also cared for a minor child in 2015 (about 2.5 million people). Those sandwich caregivers were more likely to work for pay (69.4% vs. 53.9%) and more often reported substantial financial difficulty (23.5% vs. 12.2%) and emotional difficulty (44.1% vs. 32.2%). The AARP 29% and NSOC 24% are not identical populations; both show dual-generation care is a structural feature of midlife.
These are the patients who cancel their own appointments when a school early dismissal and a parent neurology visit land on the same Tuesday. They are also the ones most likely to be managing perimenopausal symptoms while still tracking a teenager's schedule, a collision we also see in menopause costs in the workplace.
Work, earnings, and financial strain
Seven in ten working-age caregivers (ages 18-64) are employed while providing care (70%). Working caregivers average 35.6 paid hours per week on top of unpaid care. Working women caregivers are more often hourly employees than working men (55% vs. 47%). That detail matters: hourly workers report less access to telework, paid family leave, and paid sick days than salaried workers.
Work disruptions are the rule. Among working caregivers who were not self-employed, 56% went in late, left early, or took time off because of caregiving. Eighteen percent cut hours or went part-time. Sixteen percent took a leave of absence. Nine percent gave up working entirely. Eight percent turned down a promotion. Seven percent retired early. Nine percent received a performance or attendance warning. Those are the mechanisms through which caregiving becomes a long-term earnings penalty, especially for women already facing pay and retirement gaps documented in our review of the gender pay gap in medicine.
Financial strain continues even when employment holds. About half of family caregivers (47%) report at least one negative financial impact. Nearly one-third (31%) stopped saving. Twenty-four percent used up short-term savings. Thirteen percent tapped long-term savings such as retirement or education accounts. Twenty-three percent took on more debt. Fourteen percent could not afford basic expenses like food, up from 11% in 2020. Eighteen percent rate caregiving as high financial strain, with women slightly more likely than men (19% vs. 16%).
The 2025 survey does not publish a single lifetime lost-earnings number for women caregivers, and I will not invent one. What it establishes cleanly is the pathway: reduced hours, refused promotions, early exits, drained savings, and debt. Those losses concentrate among people already providing high-intensity care.
Dr. Sarah Jenkins, OB/GYN
When a midlife woman presents with new hypertension and insomnia plus a canceled follow-up, I ask about caregiving before I escalate the workup. The chart may never list "primary caregiver" as a diagnosis, but the physiology does not care whether the stressor has a billing code.
What caregiving does to health
In the 2025 AARP/NAC survey, one in five caregivers describe their own health as fair or poor (18% fair, 3% poor). Co-resident caregivers report fair or poor health more often (26%). LGBTQ+ caregivers (28%) and lower-income caregivers (32%) are higher still.
Women carry more of the subjective burden. More women than men report high physical strain (21% vs. 16%) and high emotional strain (41% vs. 33%). Nearly two-thirds of all caregivers report moderate or high emotional stress; 45% report moderate or high physical strain. Twenty-three percent find it difficult to take care of their own health because of caregiving (26% among women). Feelings of isolation have edged up: 24% report feeling alone, including 26% of women versus 20% of men.
On CDC Healthy Days items in the same survey, caregivers reported an average of 5.4 days in the past 30 when physical health was not good, 7.0 days when mental health was not good, and 4.1 days when poor health kept them from usual activities. Those are population averages, not specialty diagnoses. They still align with the pattern we track in women's mental health statistics: chronic role overload shows up in sleep and mood long before someone meets full diagnostic criteria.
Federal surveillance tells a similar story with older data. Edwards and colleagues, writing in CDC's MMWR in 2020, analyzed BRFSS caregiver-module responses from 2015-2017 across 44 states, D.C., and Puerto Rico. Overall, 20.7% of adults were caregivers. Women accounted for 58.1% of unpaid caregivers. After age adjustment, 19.2% of caregivers reported fair or poor health, ranging from 11.7% in Minnesota to 34.4% in Puerto Rico. In 19 states, that age-adjusted rate was 20% or higher. Nearly one in six non-caregivers (16.7%) expected to become caregivers within two years. Against the 2025 prevalence jump, that forecast looks conservative.
Half of caregivers in the AARP/NAC survey still say caregiving provides a sense of purpose or meaning. That finding is real. The clinical problem is not that care has no rewards. The problem is that high-intensity, under-supported care trades the caregiver's health and income for system savings no one writes on a receipt.
What the gaps mean clinically
From the exam room, three gaps show up repeatedly.
First, identification. Most electronic health records do not capture caregiver status the way they capture tobacco use. A woman providing 27 hours of weekly care can finish an annual visit without anyone asking who depends on her. Asking changes how you interpret nonadherence, missed imaging, and uncontrolled blood pressure.
Second, self-care collapse. Twenty-three percent of caregivers struggle to care for their own health. That is the mechanism behind delayed cervical and breast screening, deferred diabetes follow-up, and untreated mood symptoms. It is also why caregiver status belongs with the access barriers we document in women's healthcare access disparities.
Third, training mismatch. Fifty-five percent of family caregivers perform medical or nursing tasks; only 22% report training. Hospitals discharge complex regimens into homes staffed by exhausted daughters and partners. If you prescribe a new injectable, assume the person drawing it up may be unpaid and untrained, and already over hours.
Policy handles exist: paid family leave in a minority of states, Medicaid self-directed care that can pay some family caregivers, respite expansions, workplace flexibility. Access is uneven, and hourly workers remain least protected. Every measured caregiver-friendly workplace benefit is more common than in 2020, yet still far from universal and still tilted toward salaried employees.
For midlife women tracking irregular cycles while juggling parent care, our period calculator and late period guide can help separate perimenopausal change from stress-related disruption. They do not fix the care load. The ovulation calculator is less central here but still used when midlife cycles turn unpredictable.
The patient who stopped counting after twenty hours a week did not need a lecture on self-care. She needed her mother's med list simplified, a home-health reassessment, a note for intermittent FMLA, and a follow-up before she left the building. The statistics on this page exist so that visit is treated as standard medicine, not an exceptional favor.
Frequently asked questions about women's caregiving burden
What share of unpaid family caregivers are women?
According to AARP and the National Alliance for Caregiving's Caregiving in the US 2025 report, 61% of family caregivers of adults are women and 38% are men. CDC BRFSS data from 2015-2017 found women accounted for 58.1% of informal unpaid caregivers. Both sources put women in the clear majority.
How many hours a week do family caregivers provide?
Caregivers of adults spend an average of 27 hours per week providing care, per the 2025 AARP/NAC survey. About 24% provide 40 or more hours weekly. Women are more likely than men to provide constant care (22% vs. 16%).
What is the economic value of unpaid family caregiving in the U.S.?
AARP's 2026 economic-value update estimates $1.01 trillion for 2024, based on 59 million caregivers of adults providing 49.5 billion hours of care at an average of $20.41 per hour. That is more than all Medicaid spending that year ($932 billion).
How common is sandwich generation caregiving?
In the 2025 AARP/NAC survey, 29% of family caregivers care for a child under 18 at home while also supporting an adult. Among caregivers under 50, that share rises to 47%. Hispanic/Latino (43%) and African American/Black (36%) caregivers exceed the overall average.
Does family caregiving harm the caregiver's health?
One in five caregivers in the 2025 AARP/NAC survey report fair or poor health. Women report higher emotional strain (41% vs. 33% of men) and more difficulty caring for their own health (26%). CDC BRFSS data from 2015-2017 found 19.2% of unpaid caregivers in fair or poor health after age adjustment.
How does caregiving affect work and earnings?
Seventy percent of working-age caregivers are employed. Among working caregivers who were not self-employed, 56% go in late, leave early, or take time off; 18% cut hours; 9% stop working entirely; and 7% retire early, per Caregiving in the US 2025. About 47% of all family caregivers report at least one negative financial impact.
Tags:CaregivingUnpaid CareWomen's Health StatisticsHealthcare AccessSandwich GenerationCaregiver Health
Sources & Citations
- AARP and National Alliance for Caregiving. (2025). Caregiving in the US 2025. AARP Public Policy Institute.[Source]
- Wynn P. (2025). Exclusive: AARP-NAC report finds 45% increase in Americans providing care. AARP.[Source]
- Houser A, Caldera S, Flinn B, Choula R. (2026). Valuing the Invaluable 2026: Family caregivers' contribution reaches $1 trillion. AARP Public Policy Institute.[Source]
- AARP Public Policy Institute. (2026). The economic value of family caregiving (Valuing the Invaluable 2026 update page).[Source]
- Edwards VJ, Bouldin ED, Taylor CA, Olivari BS, McGuire LC. (2020). Characteristics and health status of informal unpaid caregivers — 44 states, District of Columbia, and Puerto Rico, 2015–2017. MMWR, 69(7), 183–188.[Source]
- Lei L, Leggett AN, Maust DT. (2023). A national profile of sandwich generation caregivers providing care to both older adults and children. Journal of the American Geriatrics Society, 71(3), 799–809. PMC10023280.[Source]
Cite this page
Journalists, researchers and educators are welcome to quote these figures. Please credit Women's Health Association and link to this page so readers can reach the underlying sources.
Women's Health Association. (2026, August 10). Women's caregiving burden statistics: unpaid hours, economic value, and health costs. Retrieved from https://www.womenshealthassoc.com/insights/womens-caregiving-burden-statistics
Published 2026, August 10

!
Medical Disclaimer
This content is for informational purposes only and is not a substitute for professional medical advice, diagnosis, or treatment. Always seek the advice of your physician or other qualified health provider with any questions you may have regarding a medical condition.
Keep Reading
View all articles
Healthcare Access 13 min read
Disability and women's healthcare access statistics: the screening, equipment, and maternal gaps that keep showing up
Women with disabilities are less likely to get mammograms and Pap tests, more likely to face inaccessible exam rooms, and in one NIH multi-hospital analysis faced 11 times the risk of maternal death. The equipment, training, and screening numbers in one place.

Healthcare Access 13 min read
Women physicians and the gender pay gap: why a majority pipeline still produces unequal pay
Women are 54.9% of U.S. medical students and 38.7% of active physicians, yet the adjusted physician pay gap returned to 26% in 2024. AAMC workforce data, Doximity compensation figures, and career-earnings research on specialty mix, leadership, full-professor rank, attrition, and burnout.
Healthcare Access 13 min read
Immigrant women's healthcare access statistics: uninsured rates, delayed prenatal care, and the chilling effect of enforcement
Nearly half of likely undocumented immigrant adults are uninsured. First-trimester prenatal care has fallen to 75.5% nationally. Language barriers, Emergency Medicaid for delivery, and chilling-effect research: the citable numbers in one place.
Evidence in your inbox.
Join 250,000+ women receiving our weekly breakdown of new research, policy changes, and health tools.